

New FOI (Freedom of Information) data analysed by the team here at Cycle SOS reveals a stark postcode lottery in pothole reporting and repairs across the UK – with some councils experiencing up to a 6642% increase in reported road defects.
As legal specialists dedicated to representing injured cyclists, Cycle SOS understands just how dangerous potholes can be. These hidden hazards aren’t just an annoyance – they can result in serious injury, costly bike damage, and traumatic crashes.
To better understand the scale of the problem, Cycle SOS submitted FOI requests to every local authority in the UK. The findings paint a worrying picture: huge disparities in how potholes are reported, responded to, and repaired.
The Worst Offenders: Councils With The Most Reported Potholes in 2024
These councils top the list for the highest number of pothole reports in 2024 (data from 1 January to 31 October), with tens of thousands of hazards logged by concerned residents. Cycle safety campaigners argue that such high numbers signal a dangerous failure to invest in safe infrastructure.
Top 20 Locations with the Most Potholes in 2024
| Rank | Council | Reported Potholes in 2024 |
| 1 | Durham CC | 66,721 |
| 2 | Cambridgeshire County Council | 36,409 |
| 3 | Norfolk CC | 35,442 |
| 4 | Leeds CC | 35,410 |
| 5 | Hertfordshire CC | 26,027 |
| 6 | Leicestershire CC | 21,810 |
| 7 | Essex County Council | 19,275 |
| 8 | West Northamptonshire Council | 17,036 |
| 9 | Central Bedfordshire Council | 12,593 |
| 10 | Northumberland CC | 11,529 |
| 11 | Bolton MBC | 9,772 |
| 12 | Birmingham City Council | 9,591 |
| 13 | Bradford City Council | 9,090 |
| 14 | Carmarthenshire CC | 8,139 |
| 15 | North Northamptonshire Council | 7,685 |
| 16 | Flintshire CC | 6,528 |
| 17 | Doncaster MBC | 6,144 |
| 18 | Liverpool CC | 5,216 |
| 19 | Hounslow BC | 5,058 |
| 20 | Calderdale MBC | 4,753 |
To illustrate the issue, we’ve also mapped the top 10 worst offending areas across the UK:
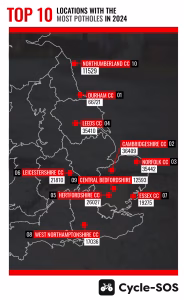
Durham County Council tops the chart by a wide margin, with more than 66,000 potholes reported – nearly double that of the second-place authority. Cambridgeshire and Norfolk reported 36,409 and 35,442 road defects, respectively. Leeds, a major urban centre with thousands of daily cyclists, also features heavily with 35,410 reports.
Councils like Hertfordshire and Leicestershire round out the top six, underscoring the ongoing infrastructure issues in both urban and rural areas. For cyclists in these areas, every ride can feel like navigating an obstacle course.
Roads in Decline: Councils With The Largest Increase in Pothole Reports from 2022 to 2024
Some councils have seen dramatic increases in reported potholes since 2022. While a rising number of reports could indicate worsening road conditions, it may also reflect improved public awareness and better reporting systems.
Top 20 Locations with the Biggest Increase in Potholes from 2022 to 2024

Northumberland’s data is especially noteworthy. The 6642% spike (from just 171 reports in 2022 to 11,529 in 2024) is largely down to a new online reporting system – a step in the right direction, as it empowers residents to report defects quickly and consistently. But the increased visibility also shines a light on how underreported issues may have been previously.
North Northamptonshire Council saw a dramatic rise in pothole reports too, with an increase of 973% between 2022 and 2024.
Darlington BC experienced a substantial 231% increase in pothole reports over the same period, while Wigan MBC recorded a notable spike, with pothole reports up by 181%.
These figures raise serious concerns about declining road quality, with implications for injuries, bike damage, and legal claims. When road defects go unrepaired, it’s not just frustrating – it’s dangerous. Cyclists are at risk of being hospitalised because councils aren’t acting fast enough.
Top 10 Locations with the Biggest Increase in Potholes from 2022 to 2024
| Rank | Council | Total Reported Defects 2022 | Total Reported Defects 2024 | Percentage Change 22 > 24 |
| 1 | Northumberland CC | 171 | 11,529 | 6642.11% |
| 2 | North Northamptonshire Council | 716 | 7685 | 973.32% |
| 3 | Darlington BC | 349 | 1155 | 230.95% |
| 4 | Wigan MBC | 1255 | 3524 | 180.80% |
| 5 | Enfield Council | 492 | 1202 | 144.31% |
| 6 | Newport CC | 735 | 1790 | 143.54% |
| 7 | Southend-on-Sea City Council | 605 | 1409 | 132.89% |
| 8 | Hammersmith & Fulham BC | 128 | 298 | 132.81% |
| 9 | Newcastle CC | 589 | 1223 | 107.64% |
| 10 | Cardiff CC | 2335 | 4719 | 102.10% |
The Best Performers: Councils That Have Made a Positive Impact from 2022 to 2024
Encouragingly, some councils have made strides in reducing pothole numbers since 2022. These are the councils that have seen the biggest fall in road defect reports over a 2-year period.
Top 10 Locations with the Biggest Decrease in Potholes from 2022 to 2024
| Rank | Council | Total Reported Defects 2022 | Total Reported Defects 2024 | Percentage Change 22 > 24 |
| 1 | Isle of Angesey CC | 3461 | 299 | -91.36% |
| 2 | Sutton BC | 619 | 112 | -81.91% |
| 3 | Doncaster MBC | 10526 | 6144 | -41.63% |
| 4 | Westminster BC | 346 | 206 | -40.46% |
| 5 | Swansea Council | 6929 | 4654 | -32.83% |
| 6 | Southwark BC | 857 | 600 | -29.99% |
| 7 | Merthyr Tydfil CBC | 1666 | 1213 | -27.19% |
| 8 | Caerphilly CBC | 5723 | 4222 | -26.23% |
| 9 | Islington BC | 6185 | 4616 | -25.37% |
| 10 | Salford City Council | 1814 | 1404 | -22.60% |
The Isle of Anglesey has seen a dramatic drop in pothole reports – over 91% (from 3,461 reports in 2022 to just 299 in 2024). While this scale of decrease might suggest changes in reporting criteria, it also reflects proactive road maintenance.
London boroughs like Sutton (-82%) and Westminster (-41%) have similarly slashed their pothole report numbers. Westminster’s performance is particularly impressive given its traffic density and central London location.
Elsewhere, improvements in Doncaster (-42%) highlight what’s possible when councils prioritise cyclist-safe infrastructure.
Are Councils Using Modern Apps?
Surprisingly, not all councils are embracing modern reporting tools. Apps like FixMyStreet, Love Clean Streets, and Fill That Hole make it easy for the public to log defects in seconds. Yet some authorities still rely solely on outdated web forms or call centres – discouraging residents from speaking up. This digital divide may contribute to underreporting in some areas.
Our research found that several councils, including Nottingham CC, Leicestershire CC and Bolton MBC, do not support any third-party reporting apps. This creates a patchy, inconsistent landscape that undermines nationwide progress on road safety.
Patchy Response Times and Poor Transparency
Cycle SOS also requested average repair times and compliance rates. Many councils were unable or unwilling to provide these figures. Some offered vague estimates, while others failed to respond at all.
Where data was available, turnaround times varied. In one authority, urgent potholes were repaired in 24 hours. In another, the average fix took more than 30 working days. For cyclists, that’s the difference between a near miss and a serious hospital visit.
The lack of national standards leaves road users vulnerable and councils unaccountable. Delays in repairs create a higher cyclist injury risk.
Cyclist Safety: The Real Cost of Delay
Every pothole left unfilled is a potential crash waiting to happen. Unlike motorists, cyclists can’t simply swerve or absorb the shock – even minor defects can cause serious accidents.
At Cycle SOS, we work closely with Cycling UK, a charity championing safer streets for riders. Together, we advocate for urgent repairs, improved reporting, and real investment in cycle-safe infrastructure. Because when roads fail, it’s cyclists who pay the price.
Know Your Rights
If you’ve been injured because of a pothole or road defect, you may be entitled to compensation. Cycle SOS has decades of experience helping cyclists hold councils accountable. From bike damage to lost income and medical bills, we can help you recover what you’re owed.
How to Take Action on Potholes
- Report defects as soon as you see them – use third-party apps like FixMyStreet or Love Clean Streets for better tracking.
- Tag your council on social media with photos and pothole locations – accountability matters.
- Push for change – demand your local authority commits to safer roads for cyclists.
- Support organisations like Cycling UK who are fighting for national infrastructure reform.
Methodology
Data obtained via Freedom of Information (FOI) requests submitted to every UK council in late 2024. Figures represent potholes and road surface defects reported by residents. Due to timing, 2024 data reflects reports from 1 January to 31 October 2024 only.